Population
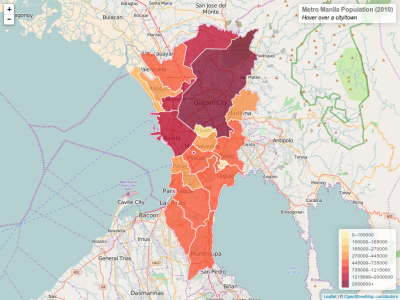
An interactive choropleth map for the population of Metro Manila LGUs.
This training module introduces Leaflet's GeoJSON features, custom event handling,
as well as creating custom control overlays.
An interactive choropleth map for the population of Metro Manila LGUs.
This training module introduces Leaflet's GeoJSON features, custom event handling,
as well as creating custom control overlays.
Let’s start with our base HTML5 template with Leaflet already linked
and our map div element already included and styled:
<!DOCTYPE html>
<html>
  <head>
    <meta charset="UTF-8">
    <title>Population</title>
    <link rel="stylesheet" href="http://cdn.leafletjs.com/leaflet/v0.7.7/leaflet.css" />
    <script src="http://cdn.leafletjs.com/leaflet/v0.7.7/leaflet.js"></script>
    <style type="text/css">

html, body {
  margin: 0;
  padding: 0;
  height: 100%;
}

#map {
  height: 100%;
  font-family: Arial, Helvetica, Verdana;
}

    </style>
  </head>
  <body>
    <div id="map"></div>
    <script>
    </script>
  </body>
</html>Our data consists of a GeoJSON file (metro_manila.js) containing the boundary data of each LGU with properties for the name and population of the LGU. Each LGU looks like this:
{
    "type": "Feature",
    "properties": {
        "name": "Manila",
        "population": 1652171,
        ...
},
    "geometry": ...
    ...
}
The boundary data was obtained from OpenStreetMap and is licensed under the Open Database License.
To use the data, download the GeoJSON file, place it in the same directory as your HTML file,
and then add the following code right before the final script element in the HTML file.
The GeoJSON object will then be available via the metroManilaData variable.
<script src="metro_manila.js"></script>It’s quite easy to use GeoJSON data in Leaflet. Once a map has been initialized,
and a JavaScript variable contains the GeoJSON data, just use the L.geoJson() method
to load the data into the map. Leaflet is able to interpret the various GeoJSON geometry types
and creates sensible default overlays for them.
var map = L.map('map').setView([14.57, 121.03], 11);
L.tileLayer('http://{s}.tile.openstreetmap.org/{z}/{x}/{y}.png', {
attribution: '© <a href="http://www.openstreetmap.org/copyright">OpenStreetMap contributors</a>',
maxZoom: 19
}).addTo(map);
L.geoJson(metroManilaData).addTo(map);Now we need to color the LGUs according to their population. Choosing nice colors for a map can be tricky, but there’s a great tool that can help with it—ColorBrewer. Using the values we got from it, we create a function that returns a color based on population:
// Logarithmic scale of population
var grades = [0,100000,165000,270000,445000,735000,1215000,2000000];

function getColorFromPopulation(p) {
    return p > grades[7] ? '#800026' :
           p > grades[6] ? '#BD0026' :
           p > grades[5] ? '#E31A1C' :
           p > grades[4] ? '#FC4E2A' :
           p > grades[3] ? '#FD8D3C' :
           p > grades[2] ? '#FEB24C' :
           p > grades[1] ? '#FED976' :
                           '#FFEDA0';
}
Next we define a styling function for our GeoJSON layer so that its fillColor
depends on feature.properties.population property, also adjusting the appearance a bit.
function style(feature) {
    return {
        fillColor: getColorFromPopulation(feature.properties.population),
        weight: 2,
        opacity: 0.7,
        color: 'white',
        fillOpacity: 0.7
    };
}Now let’s make the states highlighted visually in some way when they are hovered with a mouse.
First we’ll define an event listener for layer mouseover event:
function highlightFeature(e) {
    var layer = e.target;
    layer.setStyle({
        weight: 3,
        color: '#FF8',
        opacity: 1,
        dashArray: '',
        fillOpacity: 1
    });
    layer.bringToFront();
}
Here we get access to the layer that was hovered through e.target,
set a yellow border on the layer as our highlight effect,
also bringing it to the front so that the border doesn’t clash with neighboring LGUs.
Next we’ll define what happens on mouseout:
function resetHighlight(e) {
    geojson.resetStyle(e.target);
}
The handy geojson.resetStyle method will reset the layer style to its default state
(defined by our style function). For this to work, make sure our GeoJSON layer
is accessible through the geojson variable by defining it before our listeners
and assigning the layer to it later:
var geojson;
// ... our listeners
geojson = L.geoJson(...);
As an additional touch, let’s define a click listener that zooms to the state:
function zoomToFeature(e) {
    map.fitBounds(e.target.getBounds());
}
Now we’ll use the onEachFeature option to add the listeners on our state layers:
function onEachFeature(feature, layer) {
    layer.on({
        mouseover: highlightFeature,
        mouseout: resetHighlight,
        click: zoomToFeature
    })
}

// NOTE: The following code is modified from the existing!!!
var geojson = L.geoJson(metroManilaData, {
    style: style,
    onEachFeature: onEachFeature
}).addTo(map);
This makes the states highlight nicely on hover and gives us the ability to add other interactions inside our listeners.
We could use the usual popups on click to show information about different states, but we’ll choose a different route—showing it on state hover inside a custom control.
Here’s the code for our control:
var info = L.control();

info.onAdd = function (map) {
    this._div = L.DomUtil.create('div', 'info');
    this.update();
    return this._div;
};

info.update = function (props) {
    this._div.innerHTML = '<h4>Metro Manila Population (2010)</h4>' +
    (
        props
        ? '<b>' + props.name + '</b> – ' + props.population
        : '<i>Hover over a city or municipality</i>'
    );
};

info.addTo(map);
We need to update the control when the user hovers over a state, so we’ll also modify our listeners as follows:
function highlightFeature(e) {
    ...
    info.update(layer.feature.properties);
}

function resetHighlight(e) {
    ...
    info.update();
}
The control also needs some CSS styles to look nice:
.info {
  padding: 6px 8px;
  font-size: 14px;
  line-height: 16px;
  background: white;
  background: rgba(255,255,255,0.8);
  box-shadow: 0 0 15px rgba(0,0,0,0.2);
  border-radius: 5px;
}

.info h4 {
  font-size: 16px;
  margin: 0 0 5px;
  color: #777;
}Creating a control with a legend is easier, since it is static and doesn’t change on state hover.
var legend = L.control({position: 'bottomright'});

legend.onAdd = function (map) {
    var div = L.DomUtil.create('div', 'info legend'),
        labels = [];
    for (var i = 0; i < grades.length; i++) {
        div.innerHTML +=
            '<div><i style="background:' + getColorFromPopulation(grades[i] + 1) + '"></i> ' +
            grades[i] + (grades[i + 1] ? '–' + grades[i + 1] : '+') + '</div>';
    }
    return div;
};

legend.addTo(map);
CSS styles for the control (we also reuse the info class defined earlier):
.legend {
  font-size: 12px;
  line-height: 18px;
  color: #555;
}

.legend i {
  width: 18px;
  height: 18px;
  float: left;
  margin-right: 8px;
  opacity: 0.7;
}
And that’s it!