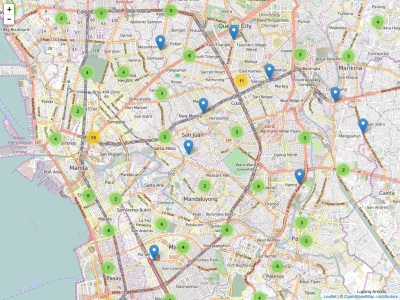
Branches
A map displaying the Metro Manila branches of Jollibee in OpenStreetMap.
This training module explains how to use the Leaflet MarkerCluster plugin
as well as composing more complex popups.
A map displaying the Metro Manila branches of Jollibee in OpenStreetMap.
This training module explains how to use the Leaflet MarkerCluster plugin
as well as composing more complex popups.
Let’s start with our base HTML5 template with Leaflet already linked and our map already initialized with the Standard OpenStreetMap tile layer.
<!DOCTYPE html>
<html>
<head>
<meta charset="UTF-8">
<title>Branches</title>
<link rel="stylesheet" href="http://cdn.leafletjs.com/leaflet/v0.7.7/leaflet.css" />
<script src="http://cdn.leafletjs.com/leaflet/v0.7.7/leaflet.js"></script>
<style type="text/css">
html, body {
margin: 0;
padding: 0;
height: 100%;
}
#map {
height: 100%;
font-family: Arial, Helvetica, Verdana;
}
</style>
</head>
<body>
<div id="map"></div>
<script>
var map = L.map('map').setView([14.57, 121.03], 11);
L.tileLayer('http://{s}.tile.openstreetmap.org/{z}/{x}/{y}.png', {
attribution: '© <a href="http://www.openstreetmap.org/copyright">OpenStreetMap contributors</a>',
maxZoom: 19
}).addTo(map);
</script>
</body>
</html>Our data consists of a GeoJSON file (jollibee.js) containing the point data of known Jollibee branches in OpenStreetMap together with their OSM tags as GeoJSON feature properties.
The data was obtained from OpenStreetMap and is licensed under the Open Database License.
To use the data, download the GeoJSON file, place it in the same directory as your HTML file,
and then add the following code right before the final script element in the HTML file.
The GeoJSON object will then be available via the jollibeeData variable.
<script src="jollibee.js"></script>Let’s check our data! Similar to the Population module, it’s very easy to load the data onto the map:
L.geoJson(jollibeeData).addTo(map);As you can see, it’s a bit of a mess with lots of overlapping markers. It would be good if we can group these markers when the map is zoomed out and then just show individual markers at a high zoom level. This function is called clustering.
Leaflet has plenty of plugins that you can use to extend the functionality of Leaflet. You can browse the official ones at Leaflet’s website. For this exercise, we will be using the MarkerCluster plugin.
To use this plugin, download the following three files into the same directory as your HTML file:
Then in your HTML file, update the head element so that the three files are loaded:
  <head>
    <meta charset="UTF-8">
    <title>Branches</title>
    <link rel="stylesheet" href="http://cdn.leafletjs.com/leaflet/v0.7.7/leaflet.css" />
    <link rel="stylesheet" href="MarkerCluster.css" />
    <link rel="stylesheet" href="MarkerCluster.Default.css" />
    <script src="http://cdn.leafletjs.com/leaflet/v0.7.7/leaflet.js"></script>
    <script src="leaflet.markercluster.js"></script>
    ...
For this plugin, the idea is to create a cluster object, and instead of adding markers directly to the map, you add the markers to this cluster object. Finally, you add the cluster object itself to the map. The cluster object will then take care of the the magical clustering functionality!
So let’s implement this step by step. First, let’s create the cluster object. Add the code below just after the code that loads the base tile layer.
var cluster = new L.markerClusterGroup();Second, we modify the GeoJSON parsing code to instead manually create markers and then add these markers to the cluster object.
var geojson = L.geoJson(jollibeeData, {
    pointToLayer: function (feature, latlng) {
        var marker = L.marker([latlng.lat, latlng.lng]);
        cluster.addLayer(marker);
        return marker;
    }
});
Basically, we added a pointToLayer option for the L.geoJson() map call.
What this does is that it lets you customize the marker that Leaflet would create for point
objects in your GeoJSON data. You supply a custom function that creates the marker or another
object that can be placed on the map and then return it.
But for this exercise, we wont’t let Leaflet add this marker (we removed the addTo() method call)
and instead add the marker to the cluster object.
That is the purpose of the cluster.addLayer(marker) line.
Finally, we add the cluster object to the map:
map.addLayer(cluster);The GeoJSON data contains all the OpenStreetMap tags that is present for the Jollibee branches.
Let’s try displaying these tags when a branch marker is clicked.
And in order to make the display more organized, we will create an HTML tables for each Jollibee marker.
The modified pointToLayer function is shown below:
var geojson = L.geoJson(jollibeeData, {
    pointToLayer: function (feature, latlng) {
        var marker = L.marker([latlng.lat, latlng.lng]);

        var content = '<table>';
        var keys = Object.keys(feature.properties);
        for (var i = 0; i < keys.length; i++) {
            content += '<tr><td>' + keys[i] + '</td>' +
                       '<td>' + feature.properties[keys[i]] + '</td></tr>';
        }
        content += '</table>';

        marker.bindPopup(content);
        cluster.addLayer(marker);
        return marker;
    }
});
And we are finished!